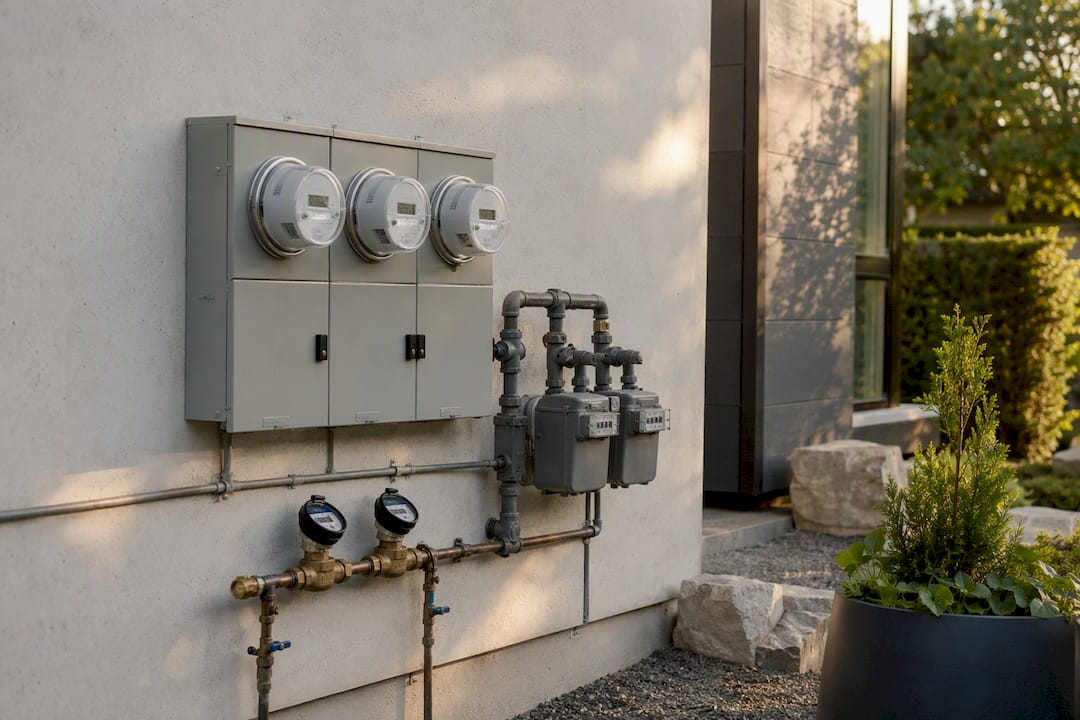
A new or single-family home typically runs roughly $450 to $600 a month in combined utilities, with the national average near $492. That figure moves fast once you factor in your state’s energy mix, and location beats every other variable on the list.
Budget below the midpoint if you’re building in a mild climate with a tight, efficient envelope. Budget above it if you’re in a hot-summer or cold-winter state with an older grid or a larger floor plan. The gap between those two scenarios can be significant, amounting to substantial costs over a 30-year mortgage.
Before anything else, check these three things:
- State and local utility rates — electricity and gas prices vary by more than double between states.
- Home size in square feet — every extra 500 square feet adds meaningfully to heating and cooling load.
- HVAC and fuel type — a heat pump in a mild climate and a gas furnace in a cold one produce very different bills.
Key Takeaways
Location and home size set the baseline for utility costs, but building envelope quality determines how far above or below that baseline a specific home actually lands.
| Point | Details |
|---|---|
| National benchmark range | Budget $450 to $600 a month for a typical new or single-family home, with $500 as the midpoint. |
| Location dominates the estimate | State electricity and gas rates can differ by more than double, so check state-specific data before a national average. |
| Electricity is the biggest line item | It typically makes up 40% to 50% of a total monthly utility bill. |
| Pull real billing history first | Twelve months of a seller’s actual bills beat any published average for address-level accuracy. |
| High-performance construction shifts the benchmark | Better Quality Builders’ AirLight steel-insulated panels are reported to cut energy bills by up to 60% versus typical stick-built homes. |
Primary Sources for Utility Benchmark Data
Each source below covers a different piece of the utility cost picture, from raw price data to retrofit guidance to new-construction comparisons.
- EIA — authoritative state and national electricity and gas price series.
- Energy.gov — retrofit and efficiency guidance for lowering usage.
- Move.org — state-by-state utility cost comparisons and national averages.
- Realtor.com — new-construction total cost of ownership research.
Table of Contents
- New Home Utility Cost Benchmarks by State and Region
- What Do Electricity, Gas, Water, and Internet Cost Separately?
- What Actually Changes a Home’s Utility Costs?
- How Do You Estimate Utility Costs for Your Address?
- Sample Monthly Utility Budgets by Home Size and Climate
- How Construction Quality Changes Your Utility Benchmark
- Where Does This Benchmark Data Come From?
- Frequently Asked Questions
- Sources
New Home Utility Cost Benchmarks by State and Region
Location does more to set your monthly bill than almost anything else you control. Move.org’s state-by-state utility research puts the national average monthly utility bill (electricity, gas, water, sewer, trash, and basic internet combined) at roughly $492, but state averages swing from the mid $300s to well over $600.
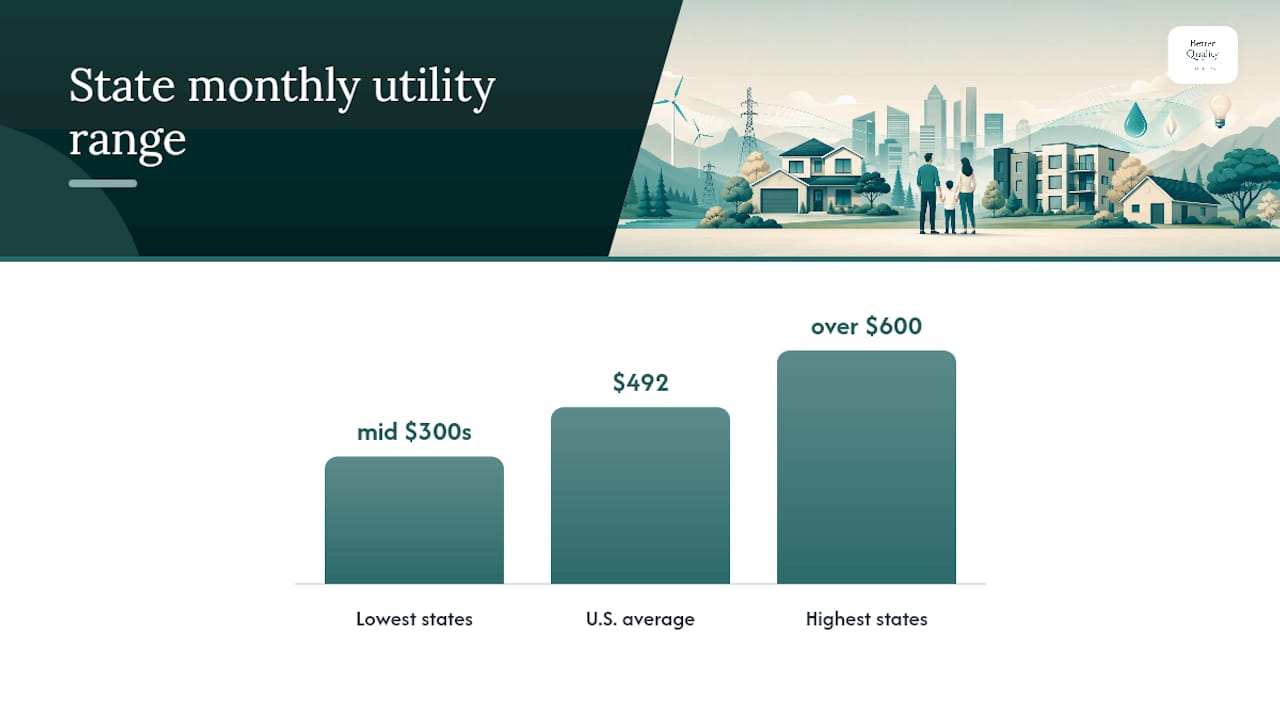
States with extreme summer heat, isolated grids, or heavy reliance on imported fuel tend to sit at the top of the list. States with mild year-round temperatures and cheap hydroelectric or natural gas supply tend to sit at the bottom.
Highest-cost states typically include:
- Hawaii, where nearly all fuel is shipped in, pushing electricity rates far above the mainland average.
- Alaska, due to isolated grids and heating demand through most of the year.
- Connecticut and Massachusetts, where aging infrastructure and high electricity rates combine.
- Texas, where extreme summer cooling loads drive high electric usage despite competitive rates.
Lowest-cost states typically include:
- Utah and Idaho, thanks to cheap hydroelectric power and mild shoulder seasons.
- New Mexico, where dry heat requires less energy-intensive cooling than humid climates.
- Washington, where hydropower keeps electricity rates well below the national median.
Regionally, the Northeast pays a heating premium tied to natural gas and heating-oil costs during long winters, while the South pays a cooling premium from extended air-conditioning season. The Midwest lands in between, with older housing stock offsetting relatively cheap electricity. The West is the most variable region on the map, since a home in coastal California and a home in rural Idaho can post utility bills $200 apart despite sharing a region.
If you want to run these numbers against your specific ZIP code, a calculator like the one from USA Salary Tools blends EIA rate data with Census figures to generate a localized estimate rather than a flat regional average. That’s a smarter starting point than eyeballing a national number and hoping it fits your street.
What Do Electricity, Gas, Water, and Internet Cost Separately?
Electricity is almost always the largest single line item on a new homeowner’s utility bill, often making up a large portion of the total monthly spend. Everything else, gas, water, trash, and internet, splits the remainder in smaller, more predictable chunks.
- Electricity: typically ranging from around $130 to $220 a month nationally, driven mostly by HVAC runtime, water heating, and appliance load. EIA price and sales data shows this is the line item most exposed to state-level rate differences, since some states charge nearly double the per-kilowatt-hour rate of others.
- Natural gas: generally between $50 and $120 a month in gas-heated homes, with usage concentrated almost entirely in the winter months. EIA’s natural gas price analysis notes regional pipeline access as a major factor in why some states pay far less than others for the same fuel.
- Water and sewer: Averaging close to $70 a month nationally, according to Statista’s water cost data, though this varies with household size, irrigation habits, and local infrastructure investment.
- Trash and recycling: usually a flat monthly fee set by the municipality, often between $20 and $40, with little seasonal variation.
- Internet, phone, and TV: $50–$150 a month depending on speed tier and bundling, with FCC broadband data showing wide availability gaps that push rural buyers toward pricier satellite or fixed-wireless options.
Optional add-ons like cable packages and home security monitoring can tack on another $30 to $100 a month, and buyers frequently forget to budget for them until the first bill arrives. Electricity and natural gas are also the two line items most likely to swing month to month, since both respond directly to weather. If you want the most current provider-specific rate for your address, calling the local utility beats relying on any published average, since published figures are always a blend across many households.
What Actually Changes a Home’s Utility Costs?
Climate, building envelope, and HVAC fuel type control most of the variation between one home’s utility bill and another’s. A poorly insulated house in a hot climate with an inefficient air conditioner can cost double what an identical-sized, well-sealed home costs in the same ZIP code.
Climate sets the baseline demand for heating and cooling. The building envelope, meaning insulation, air sealing, and window performance, determines how much of that demand actually reaches your equipment. HVAC and fuel type then determine how expensive it is to meet whatever demand gets through.
Beyond those three, several smaller factors move the number up or down:
- Occupancy — more people in the house means more hot water, laundry, and electronics running.
- Usage behavior — thermostat habits and shower length matter more than most buyers assume.
- Appliance efficiency — an older refrigerator can quietly cost $10 to $15 more a month than an ENERGY STAR replacement.
- Local rate structure — tiered pricing or time-of-use rates can penalize high summer usage specifically.
- On-site solar generation — a properly sized system can offset a meaningful share of the electric bill.
Pro Tip: Smart thermostats save money on average, but Cornell research on grid interactions found that when thousands of them recover from a preprogrammed setback at the same time, they can spike local grid demand. That’s a utility-side concern more than a homeowner one, but it explains why some time-of-use rate plans specifically penalize that exact behavior pattern.
How Do You Estimate Utility Costs for Your Address?
Start with the seller’s actual bills, then layer in ZIP-code data, provider quotes, and square-footage adjustments, in that order. Each step narrows the estimate closer to what you’ll actually pay.
- Request 12 months of prior utility bills from the seller or listing agent, since a single month tells you almost nothing about seasonal swings.
- Run the address through a ZIP-code utility calculator to sanity-check the seller’s numbers against local averages.
- Call the electric and gas providers directly and ask for the current rate schedule and any new-construction connection fees.
- Adjust for square footage and HVAC differences if the home you’re buying is larger, smaller, or better insulated than the one the bills came from.
- Add fixed monthly fees for trash, water base charges, and internet that don’t show up in a rate-per-kilowatt-hour quote.
When you talk to the seller, agent, or utility provider, ask direct questions: What were the highest and lowest bills in the past year? Is the home on a flat rate or time-of-use pricing? Are there any pending rate increases filed with the state utility commission? Many municipalities, like Austin’s published fee schedule, list connection charges and recurring fees publicly, and it’s worth checking whether your target city does the same.
Here’s a mini calculation to convert usage into dollars: if the seller’s bills show 900 kilowatt-hours a month at a state average rate of $0.16 per kilowatt-hour, that’s $144 for electricity alone. Add 40 therms of gas at roughly $1.20 per therm for another $48, then tack on $70 for water and sewer, $30 for trash, and $80 for internet. That lands you at roughly $372, before adjusting for any size or efficiency differences between the seller’s home and yours.
Sample Monthly Utility Budgets by Home Size and Climate
Pick the scenario that matches your square footage and climate zone, then nudge up if you’re moving into an older grid or down if your new build includes a high-performance envelope. These figures represent typical ranges, not guarantees.
An empty-nester in a smaller, mild-climate home may see utilities representing a lower share of income. A remote worker running a home office all day, with extra HVAC and electronics load, should budget toward the higher end of whichever row fits their square footage.
Mortgage lenders increasingly ask for a realistic utility figure during affordability workups, and a padded estimate protects you from a nasty surprise the first summer or winter in the house.
How Construction Quality Changes Your Utility Benchmark
High-performance construction can push a home’s utility costs well below the benchmarks in the tables above, sometimes by a wide enough margin to change which row of the sample budget applies to you. The gap between a code-minimum stick-built home and a home built with a tighter, better-insulated envelope shows up every single month on the electric bill, not just at closing.
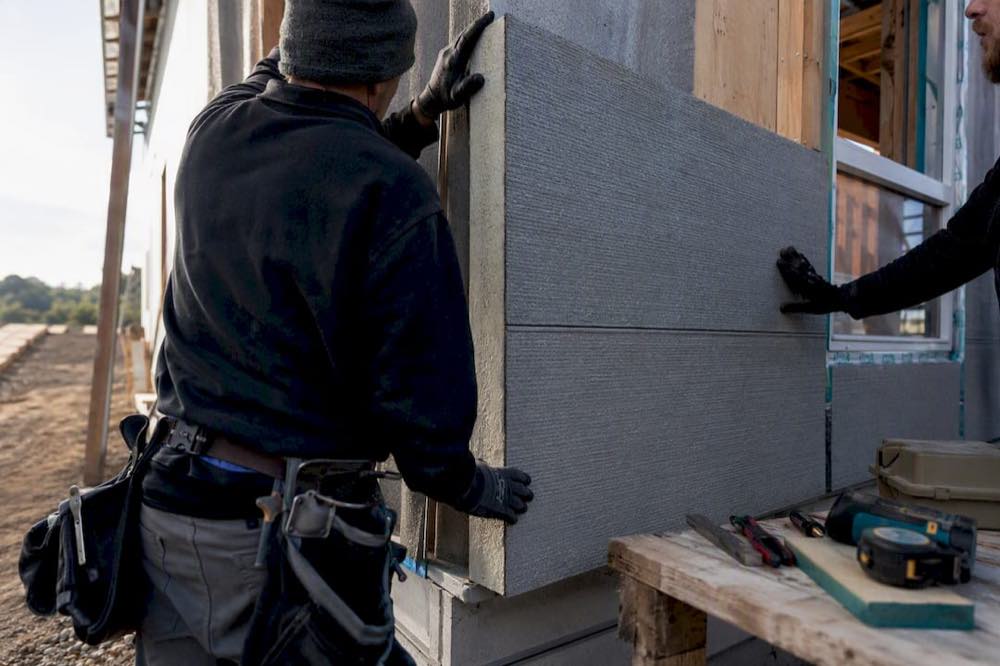
Better Quality Builders uses AirLight steel-insulated panels instead of conventional framing, and the company reports energy bill reductions of up to 60% compared to typical stick-built construction of the same size. Picture two identical 2,200-square-foot homes in the same hot-climate ZIP code: one built to minimum code with standard framing, the other with a steel-insulated panel envelope. The second home’s cooling load drops enough that its owner could realistically move from the top of the “hot climate” budget band into the middle of the “mild climate” one, just from the envelope difference.
Pro Tip: If you’re prioritizing upgrades on a budget, put your money into the building envelope first, then an efficient HVAC system, then a heat-pump water heater last. Energy consistently shows envelope improvements deliver the fastest payback of the three, because they reduce demand instead of just meeting it more efficiently.
New construction built to current codes also tends to beat older housing stock on total cost of ownership over a decade, once you factor in both utility savings and lower repair frequency. That’s a comparison worth running before assuming an older, cheaper home is actually the better financial deal.
Where Does This Benchmark Data Come From?
These benchmarks draw primarily from EIA electricity price tables, Move.org’s state utility survey, and Statista’s water cost tracking, covering the most recent published rate and consumption data available at the state level.
State averages get built by weighting electricity, gas, water, sewer, trash, and internet costs according to typical household consumption patterns in that state, not just averaging every published rate equally. The result represents a typical monthly spend for a comparable household, not a guaranteed number for any single address.
A few caveats matter here:
- Extreme-weather years can push a single month’s bill well outside the normal range.
- Utility rate changes get filed and approved on a rolling basis, so a table snapshot ages faster than most benchmark data.
- Your most accurate number will always come from combining a published state average with the seller’s actual 12-month billing history for your specific address.
A Builder’s View on Planning for Utility Costs
Years spent building homes with tighter envelopes than code requires has made one thing clear: buyers consistently underestimate how much the building shell itself controls their monthly bill, long before HVAC efficiency even enters the conversation. When advising buyers, the two habits worth repeating are: always pull 12 months of prior bills before trusting a listing agent’s verbal estimate, and treat any advertised “average” as a starting point, not a promise. If you’re comparing a new build’s projected performance against an existing home, ask for real case-study data, not marketing language.
Build a Home That Beats the Benchmark
Most of the benchmarks above assume standard construction, which means most new homeowners are budgeting for utility bills they don’t actually have to accept. Better Quality Builders is the alternative to conventional stick-built construction for Arizona homebuyers who want their monthly utility bill to come in below the state average, not at it.
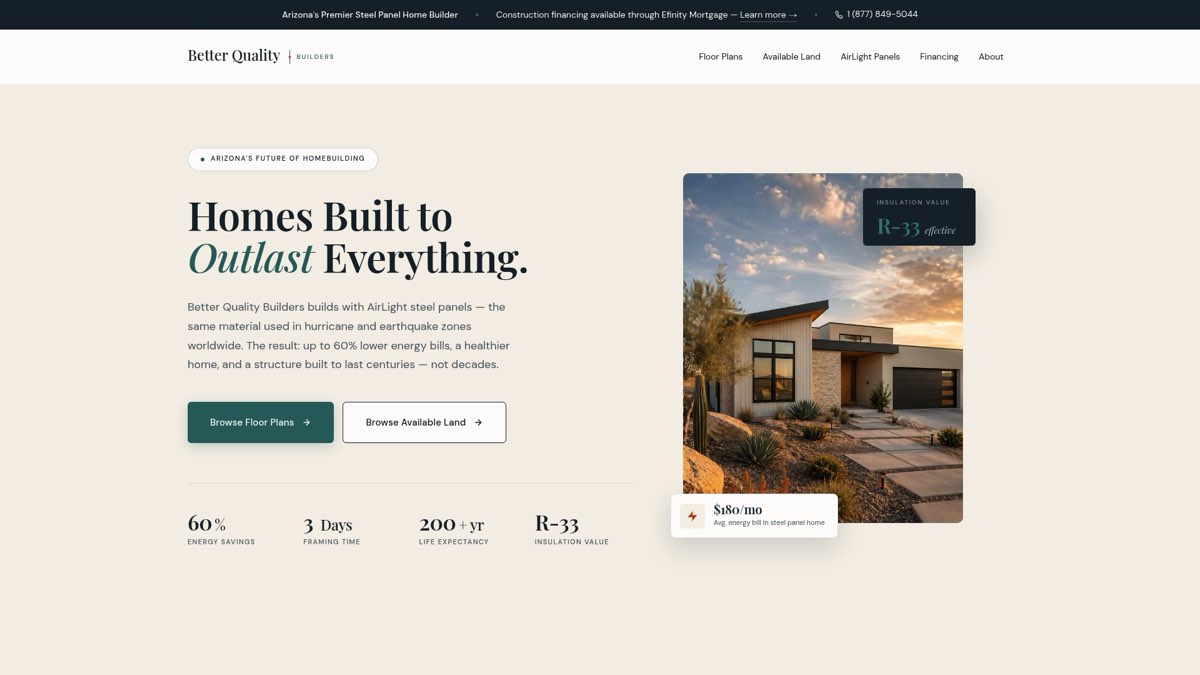
Building with AirLight steel-insulated panels instead of traditional framing means a tighter envelope from day one, with reported energy bill reductions of up to 60% compared to typical construction. If you’re planning a build in Maricopa County or elsewhere in Arizona, request a sample energy performance estimate and see what a steel-panel envelope would do to your projected monthly bill before you commit to a floor plan.
Frequently Asked Questions
What is a realistic monthly utility budget for a new home? Most new or single-family homes run $450 to $600 a month combined, with the national average near $492. Your actual number depends heavily on state energy rates and home size.
Which utility usually costs the most?
How long does it take for utility costs to stabilize after moving in? Most homeowners see bills fluctuate for the first two to three billing cycles as usage patterns settle, then stabilize into a predictable seasonal pattern by the second year.
Do new-construction homes really cost less to run than older homes? Often, yes. Realtor.com’s ownership cost research shows new construction commonly delivers measurable utility and maintenance savings over a decade compared to homes built 20 years earlier, largely due to updated codes and equipment.
How much can a high-performance envelope actually save on utilities?
This article is general information, not a substitute for advice from a qualified financial advisor. Consult a qualified financial professional about your own circumstances before acting on anything here.
Sources
- EIA — Electricity sales, revenue, and prices (Table 5A)
- Statista — Average monthly cost of water in the U.S.